Calculating Percentages in Blood Test Score Report
How are the results for the Blood test Score report calculated?
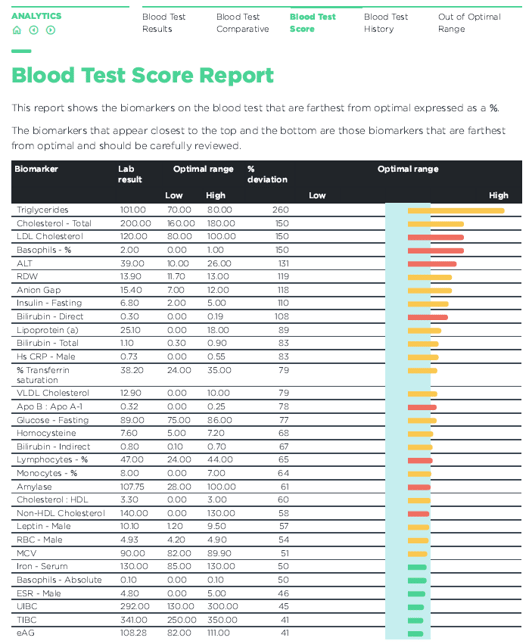
The blood test score report provides a visualization of all biomarker results using a common scoring calculation. Each biomarker has its own range and unit that is used to express the result from each blood test. Unfortunately, there's no way to do a comparison between biomarker results. The blood test score report is ODX's way of providing that comparison.
We wanted to be able to answer this question: of all the 108 biomarkers on a very comprehensive blood panel, which biomarkers are the most out of range, high and low? In order to do this, we came up with a calculation that determined what we called "the % deviation from the median".
Here's how the scoring is added up:
HighEquationScore = ((s.ResultBiomarkerValue - (s.BiomarkerOpHigh - ((s.BiomarkerOpHigh - s.BiomarkerOpLow) / 2))) * 100) / (s.BiomarkerOpHigh - s.BiomarkerOpLow)
s.ResultBiomarkerValue = the actual biomarker result
s.BiomarkerOpHigh = Optimal High
s.BiomarkerOpLow = Optimal Low
This may look complicated but it's just expressing the biomarker result as a percentage away from the median of the optimal range. You could calculate this yourself but why bother! Let ODX do it for you with the Blood Test Score Report that comes with your Functional Health Report:

![kb-odx-application-logo-white.png]](https://kb.optimaldx.com/hs-fs/hubfs/kb-odx-application-logo-white.png?height=50&name=kb-odx-application-logo-white.png)